New! Dashboards: your data, visualized

Rows and columns — that’s how your data is written and read.
But if you want a high-level perspective?
It’s pretty tough to go through 4,000 rows and go “ah yes, a clear upward trend.”
So what do people do?
They export data into spreadsheets and paste it into BI tools, screenshot the result, send it to management, and do the whole song and dance again next week. And the one after that.
We’d rather you didn’t have to.
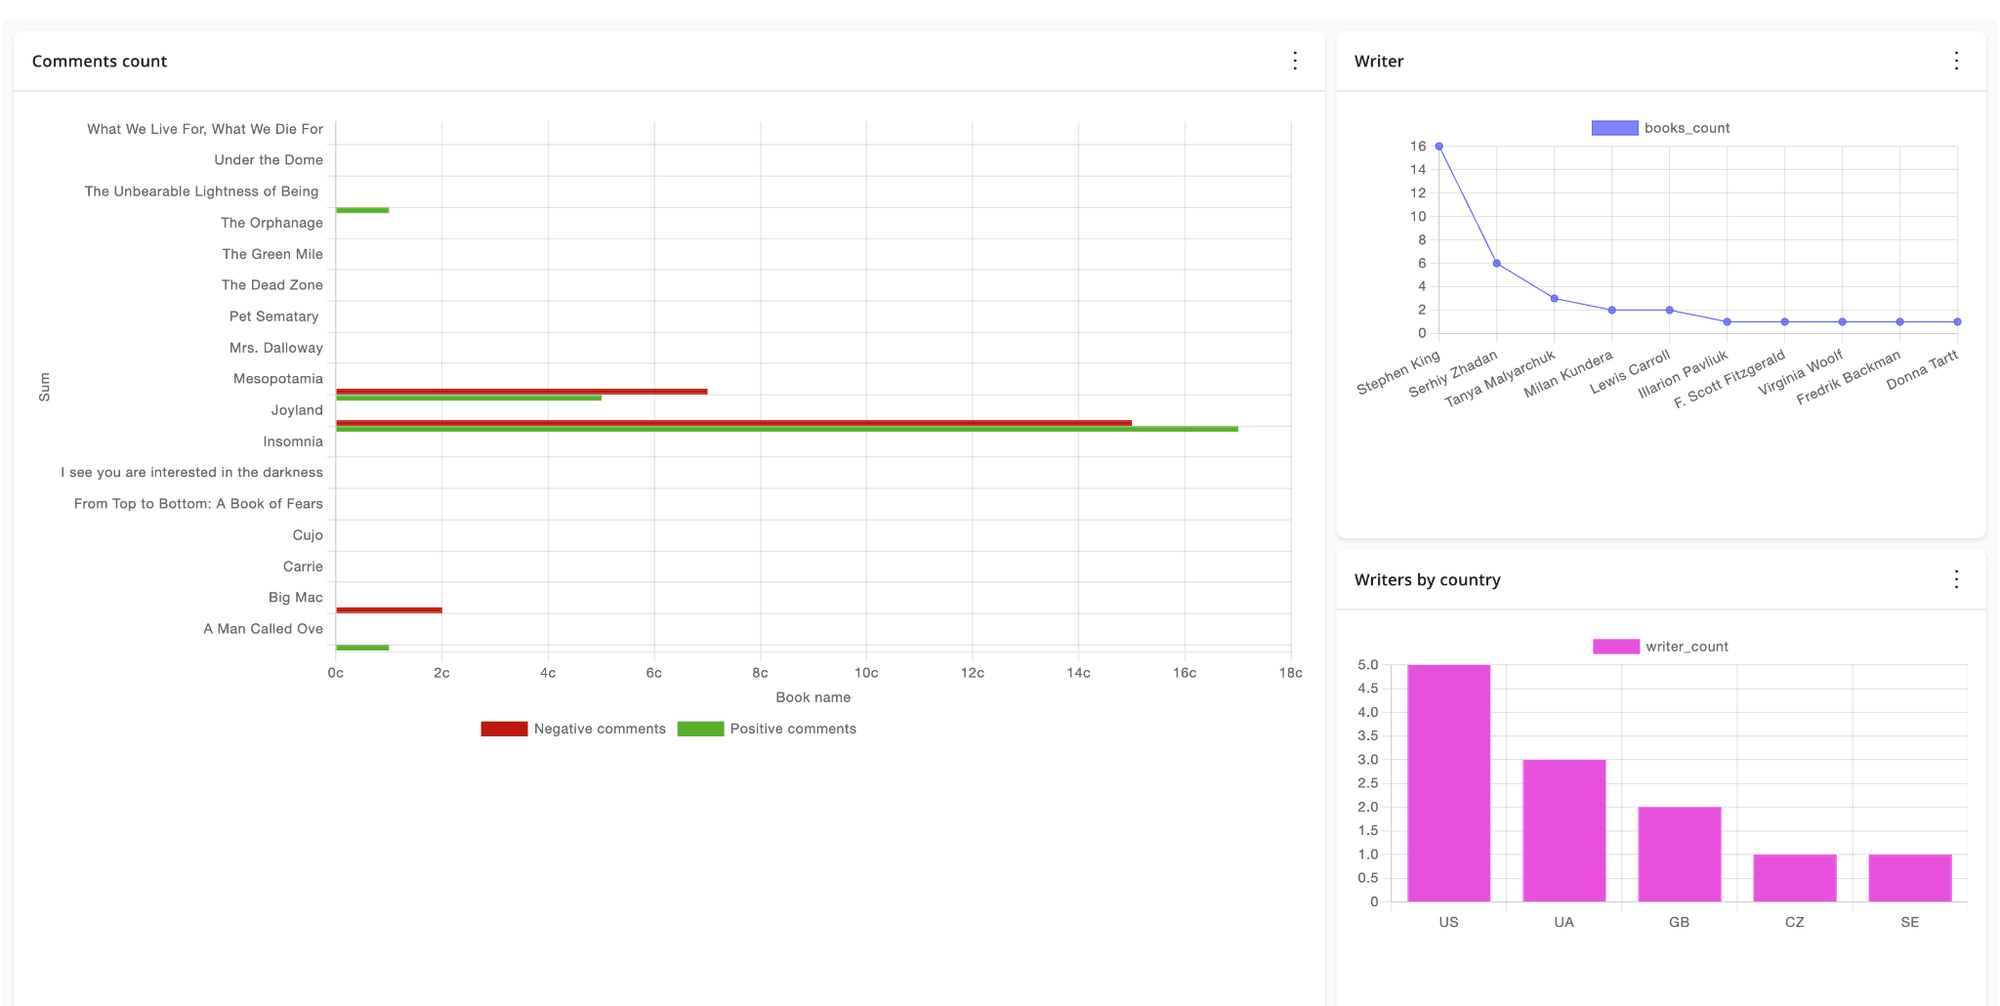
Which is why Rocketadmin now has Dashboards — custom chart pages built directly on your database, living right next to your tables.
Where to find it & how it works
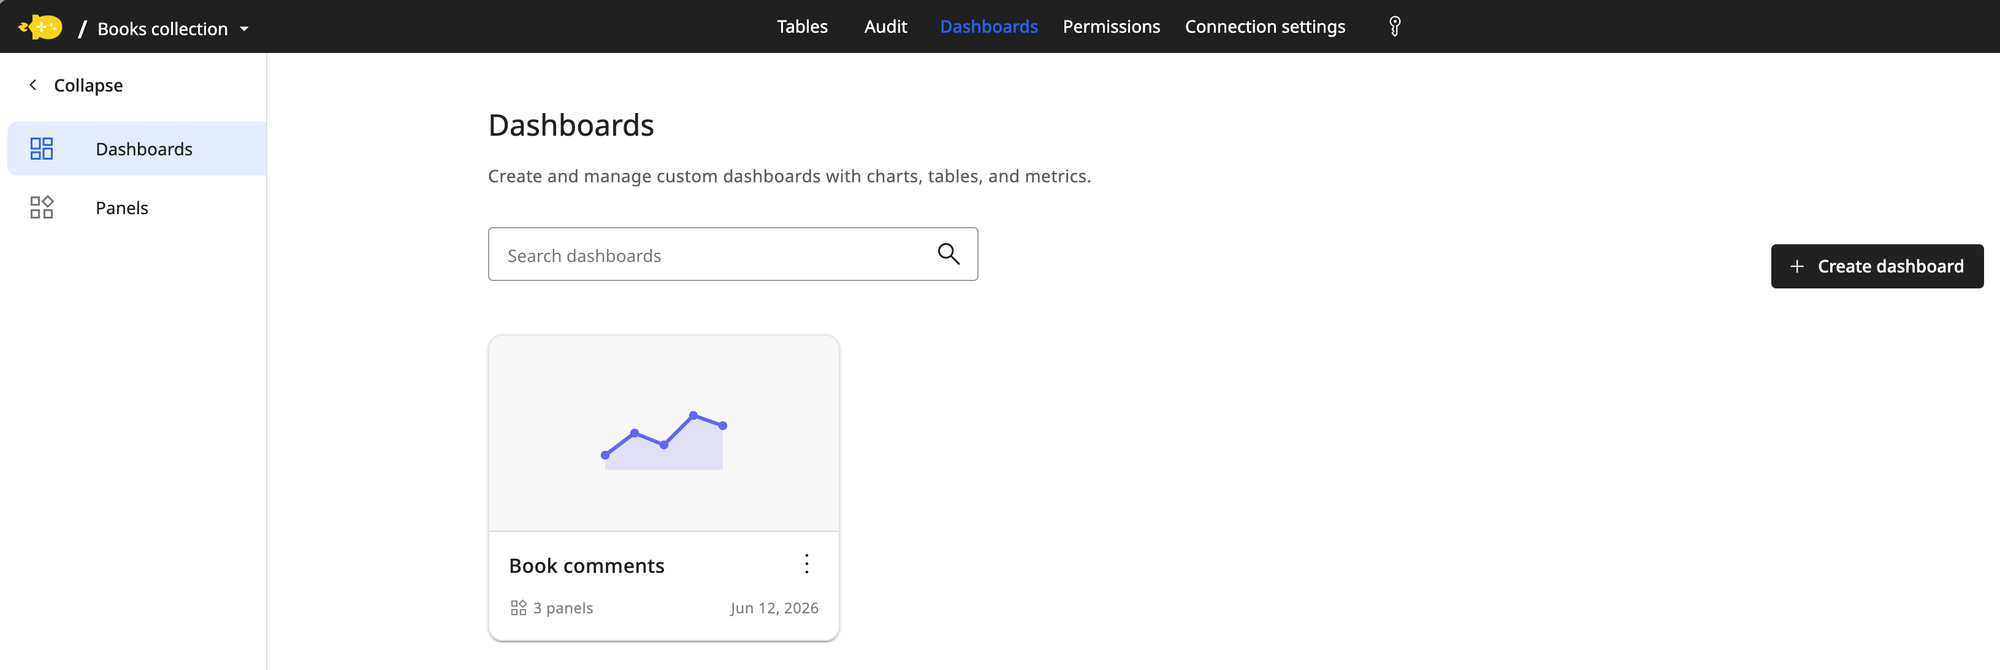
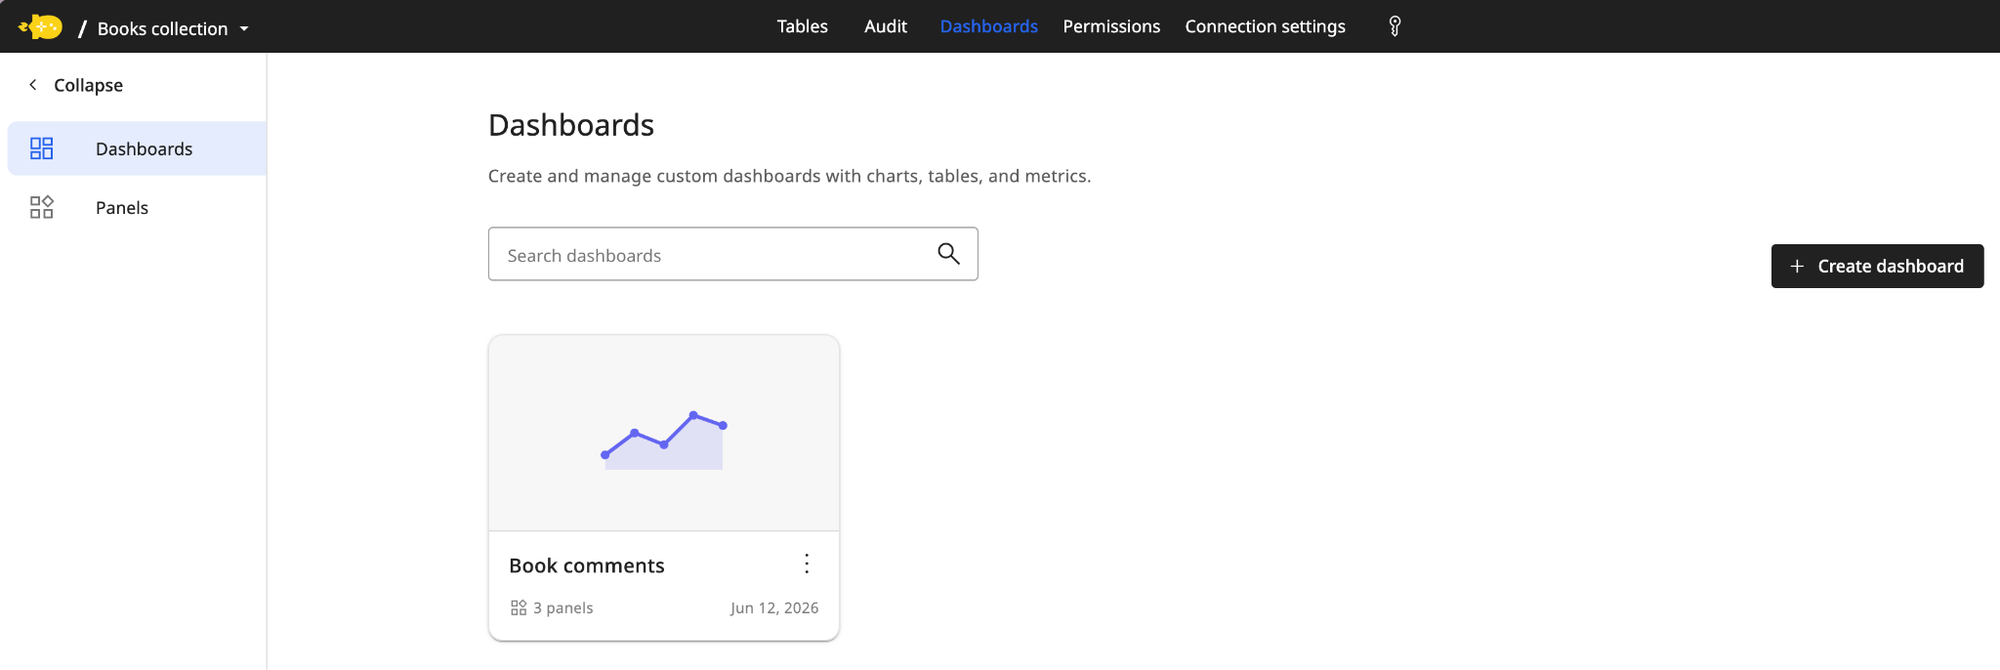
Open any connection and you'll see a new Dashboards tab in the top navigation, right between Audit and Permissions.
Once there, you can see your already-created Dashboards. Just click on Create dashboard to make a new one.
In order to create a dashboard, you first need to create panels. These are the types of visualizations you can see on your dashboard.
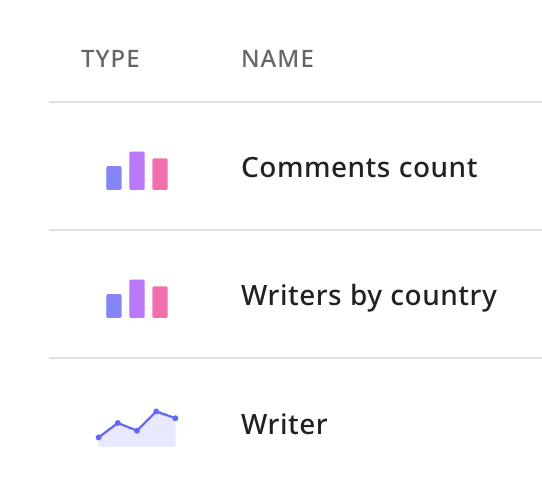
Once they’re set up, you can use your dashboard.
📄 You can find our documentation here 👉 https://docs.rocketadmin.com/Reference/dashboards
Try it out!
Dashboards make it effortless to really make use of your data. Rocketadmin isn’t just a place to store strings — it’s now also a way to get a bird’s eye view of what’s really happening under the hood.
Also useful to show management that things are going well.
And if they’re not?
Now it’ll be easier to figure out why.